

CANtrace 5.0
Trace, Analyze & Troubleshoot
CAN communication
Built for every stage of CAN analysis
From raw data to readable values
Trace and Decode Signals
Monitor real-time CAN traffic in Trace and use a DBC database to decode raw messages into named signals with physical values and units.
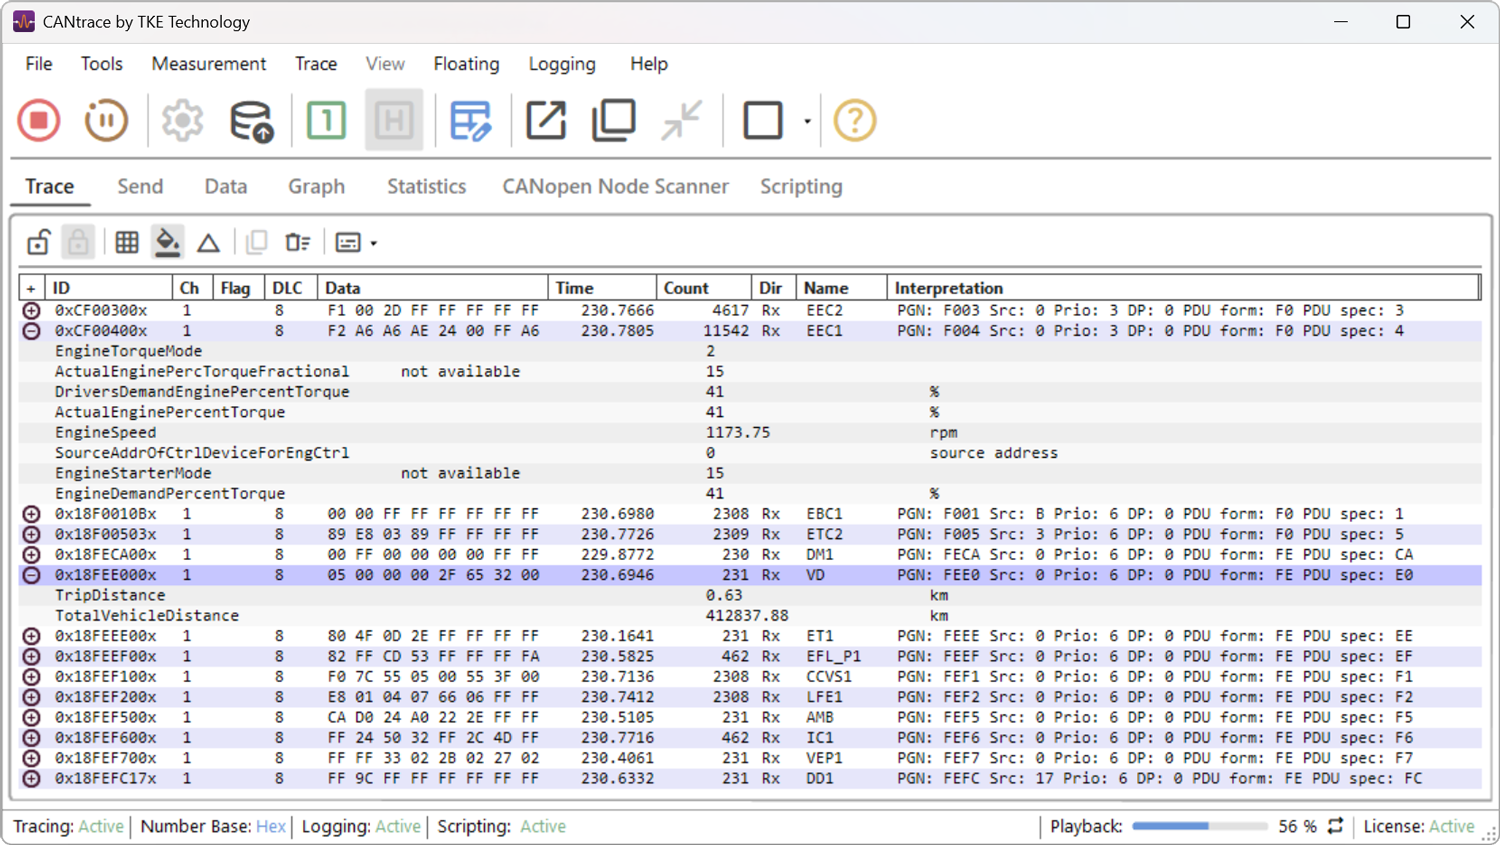
J1939 database included
Start decoding standard J1939 signals with the supplied database, without building one from scratch.
Database editor included
Create and edit CAN message and signal definitions with the bundled Kvaser Database Editor.
Up to 9 CAN channels
Monitor and log communication from up to nine CAN channels simultaneously.
Record CAN traffic and replay messages
Logging and Playpack
Record CAN traffic for later analysis. Review recordings in Trace, Data and Graph, or send recorded messages back to the CAN bus for testing.
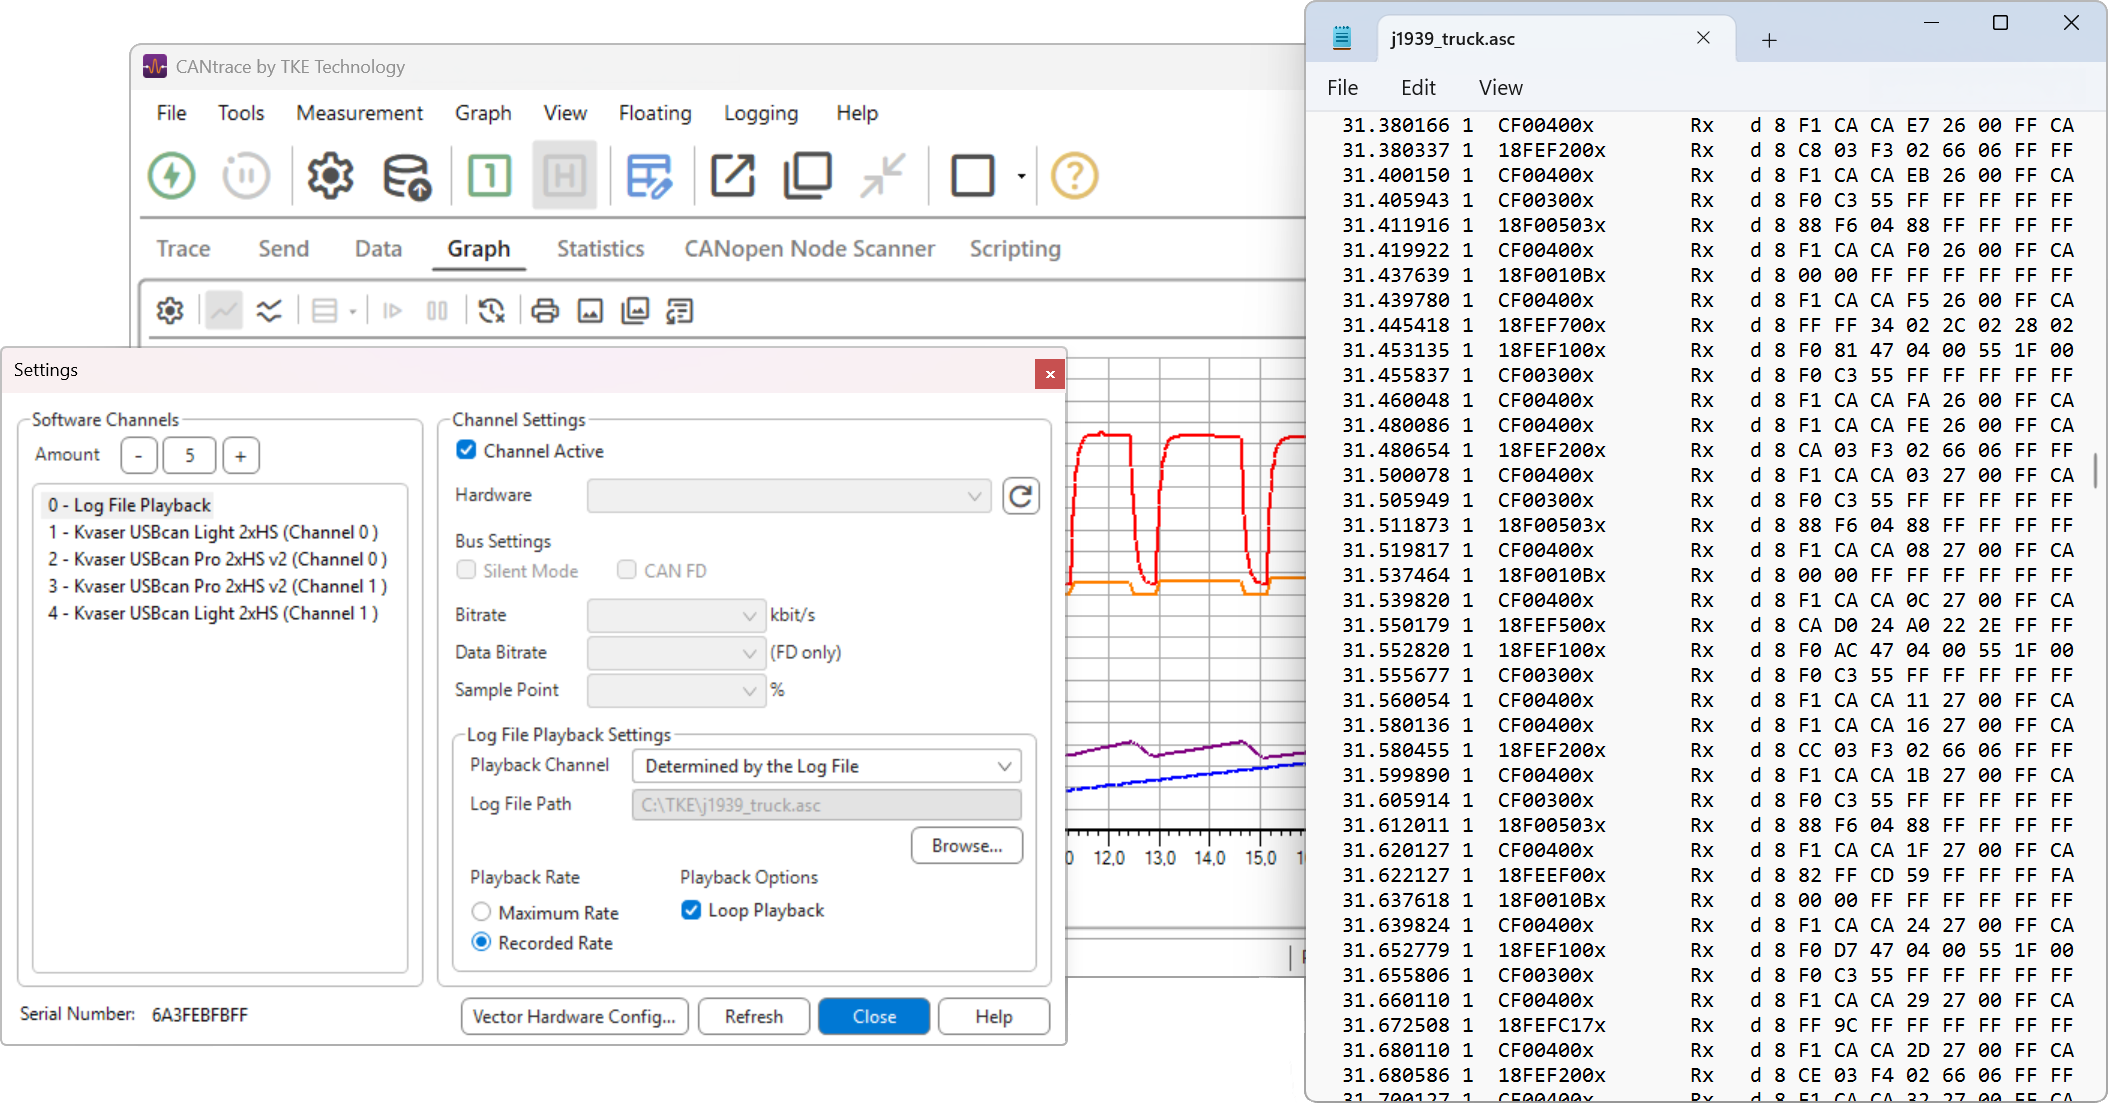
Replay to the CAN bus
Send recorded messages back to a physical CAN bus through a connected interface to investigate how your devices respond.
Import and export log files
Read and write Vector ASCII and BLF log files to exchange recordings with other software that supports the same formats.
Repeat with loop playback
Replay recorded messages continuously to repeat test sequences and investigate issues.
Signal graphing
Visualize CAN Signals
Plot signal values and CAN network activity to analyze system behavior and identify communication issues.
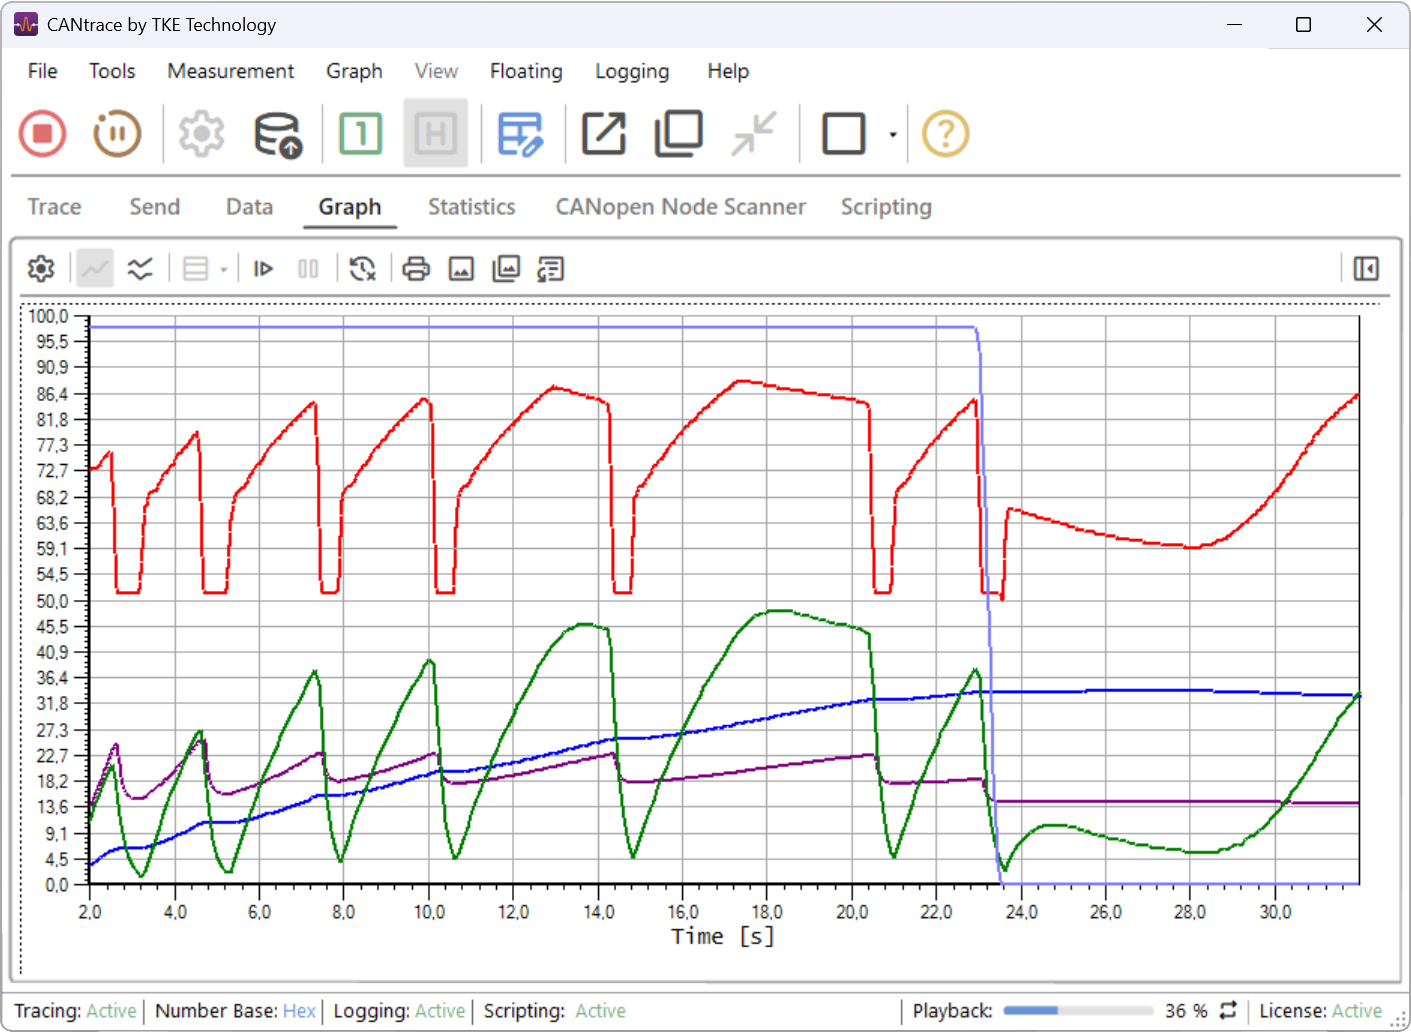
Two configurable views
Compare signals together in Single Graph View or display them in separate plots in Multi Graph View.
Find and configure signals easily
Search database messages and signals by name, or narrow the selection to signals seen in Trace.
Customize your graphs
Adjust colours, scales and plotting styles to make signal changes easier to see.
Set the value. Send the message.
Configure and Send CAN Messages
Test how your devices respond by sending CAN messages with the values you choose. Configure messages manually or use database definitions to simplify setup.
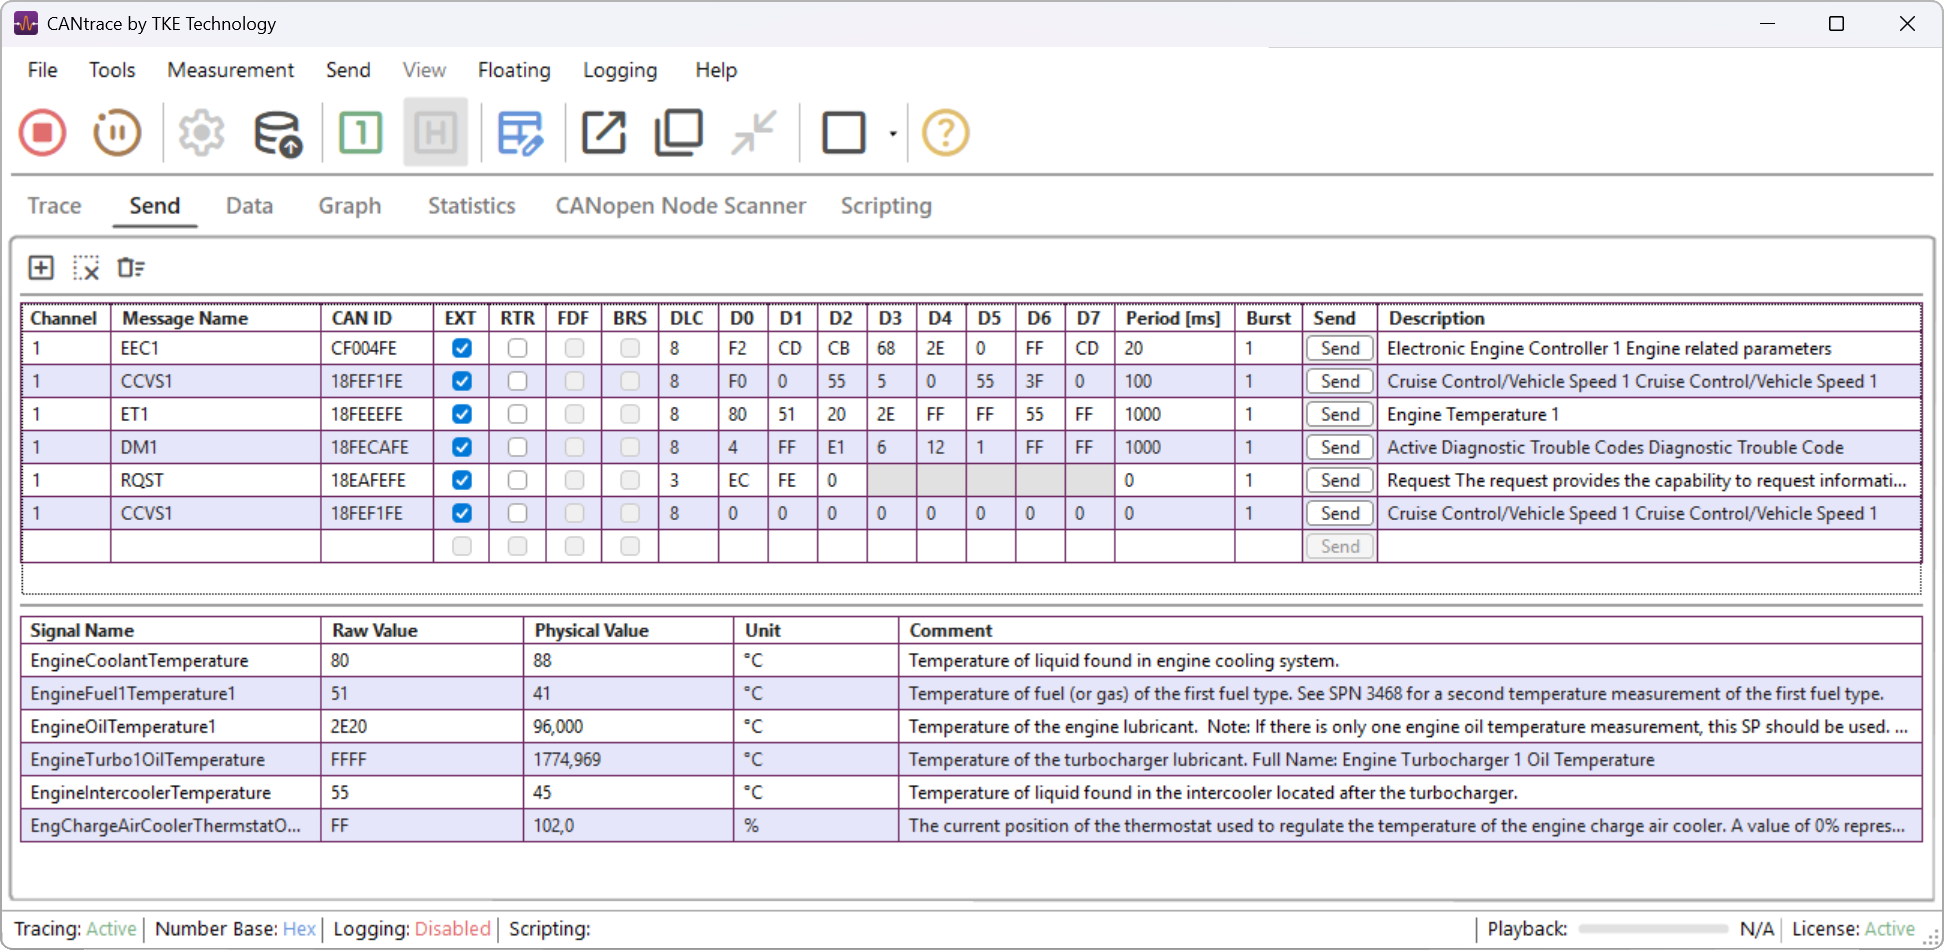
Configure new messages
Set the CAN identifier, channel, message data and transmission interval for the messages you want to send.
Send messages from a database
Select messages from an associated database to use existing message and signal definitions.
Enter physical signal values
Enter the signal value you need and let CANtrace update the message data, without calculating the raw bytes manually.
Protocol support
Built-in CANopen and J1939 Support
Decode protocol messages and inspect device communication with built-in tools for CANopen and SAE J1939.
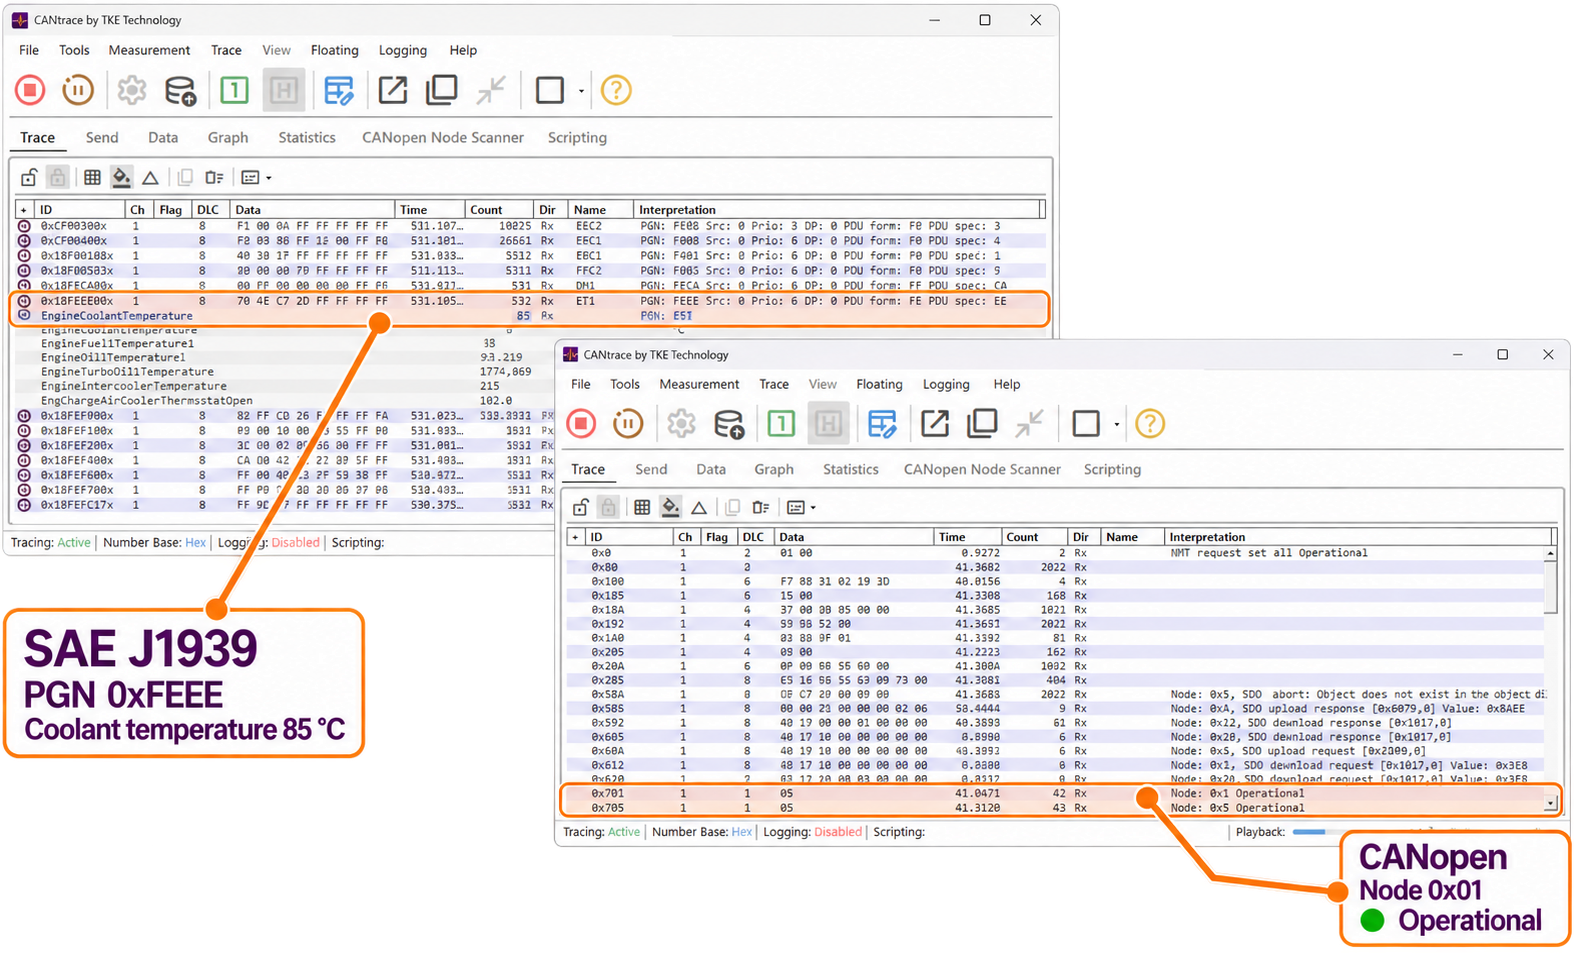
Included J1939 Database
Decode standard J1939 signals into readable names, values and units using the included database.
J1939 transport protocol support
Decode J1939 messages spanning multiple CAN frames and view PGNs and source addresses.
CANopen communication
Find nodes, check heartbeat states and decode CANopen messages, including NMT, EMCY and SDO.
Know what’s happening on the bus
Bus Statistics
Get a clear view of communication activity across your configured CAN channels. Follow frame rates, error frames and bus load to support diagnostics and troubleshooting.
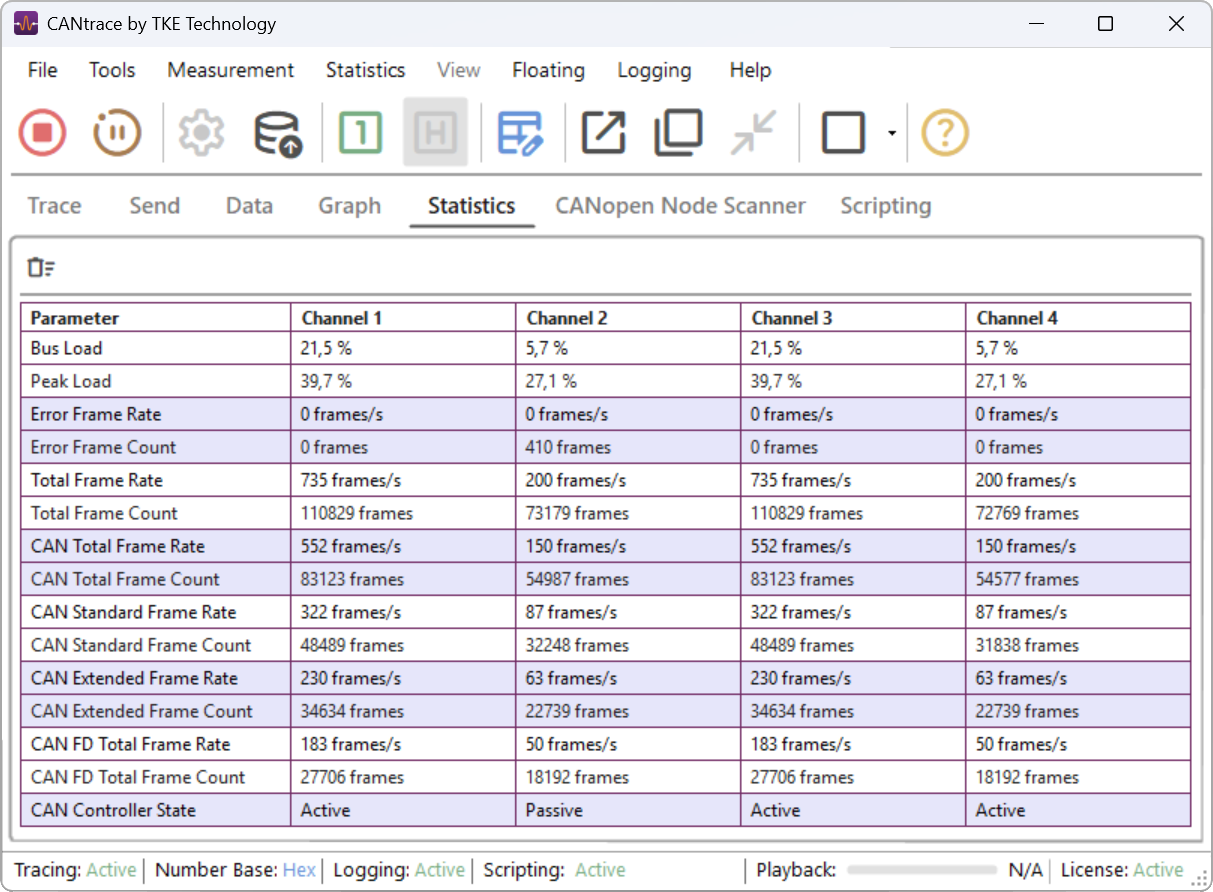
CAN and CAN FD frame rates
View separate frame rates for CAN and CAN FD, together with combined statistics for overall communication activity.
Error frame statistics
Monitor error frames per second and total error frame counts to help identify communication problems.
Bus load and peak load
Check current bus utilisation and the highest recorded load to understand how heavily the network is being used.
Keep every view in sight
Flexible workspace and layout
Arrange views to suit your workflow. View messages, signals, graphs and statistics side by side without switching between tabs.
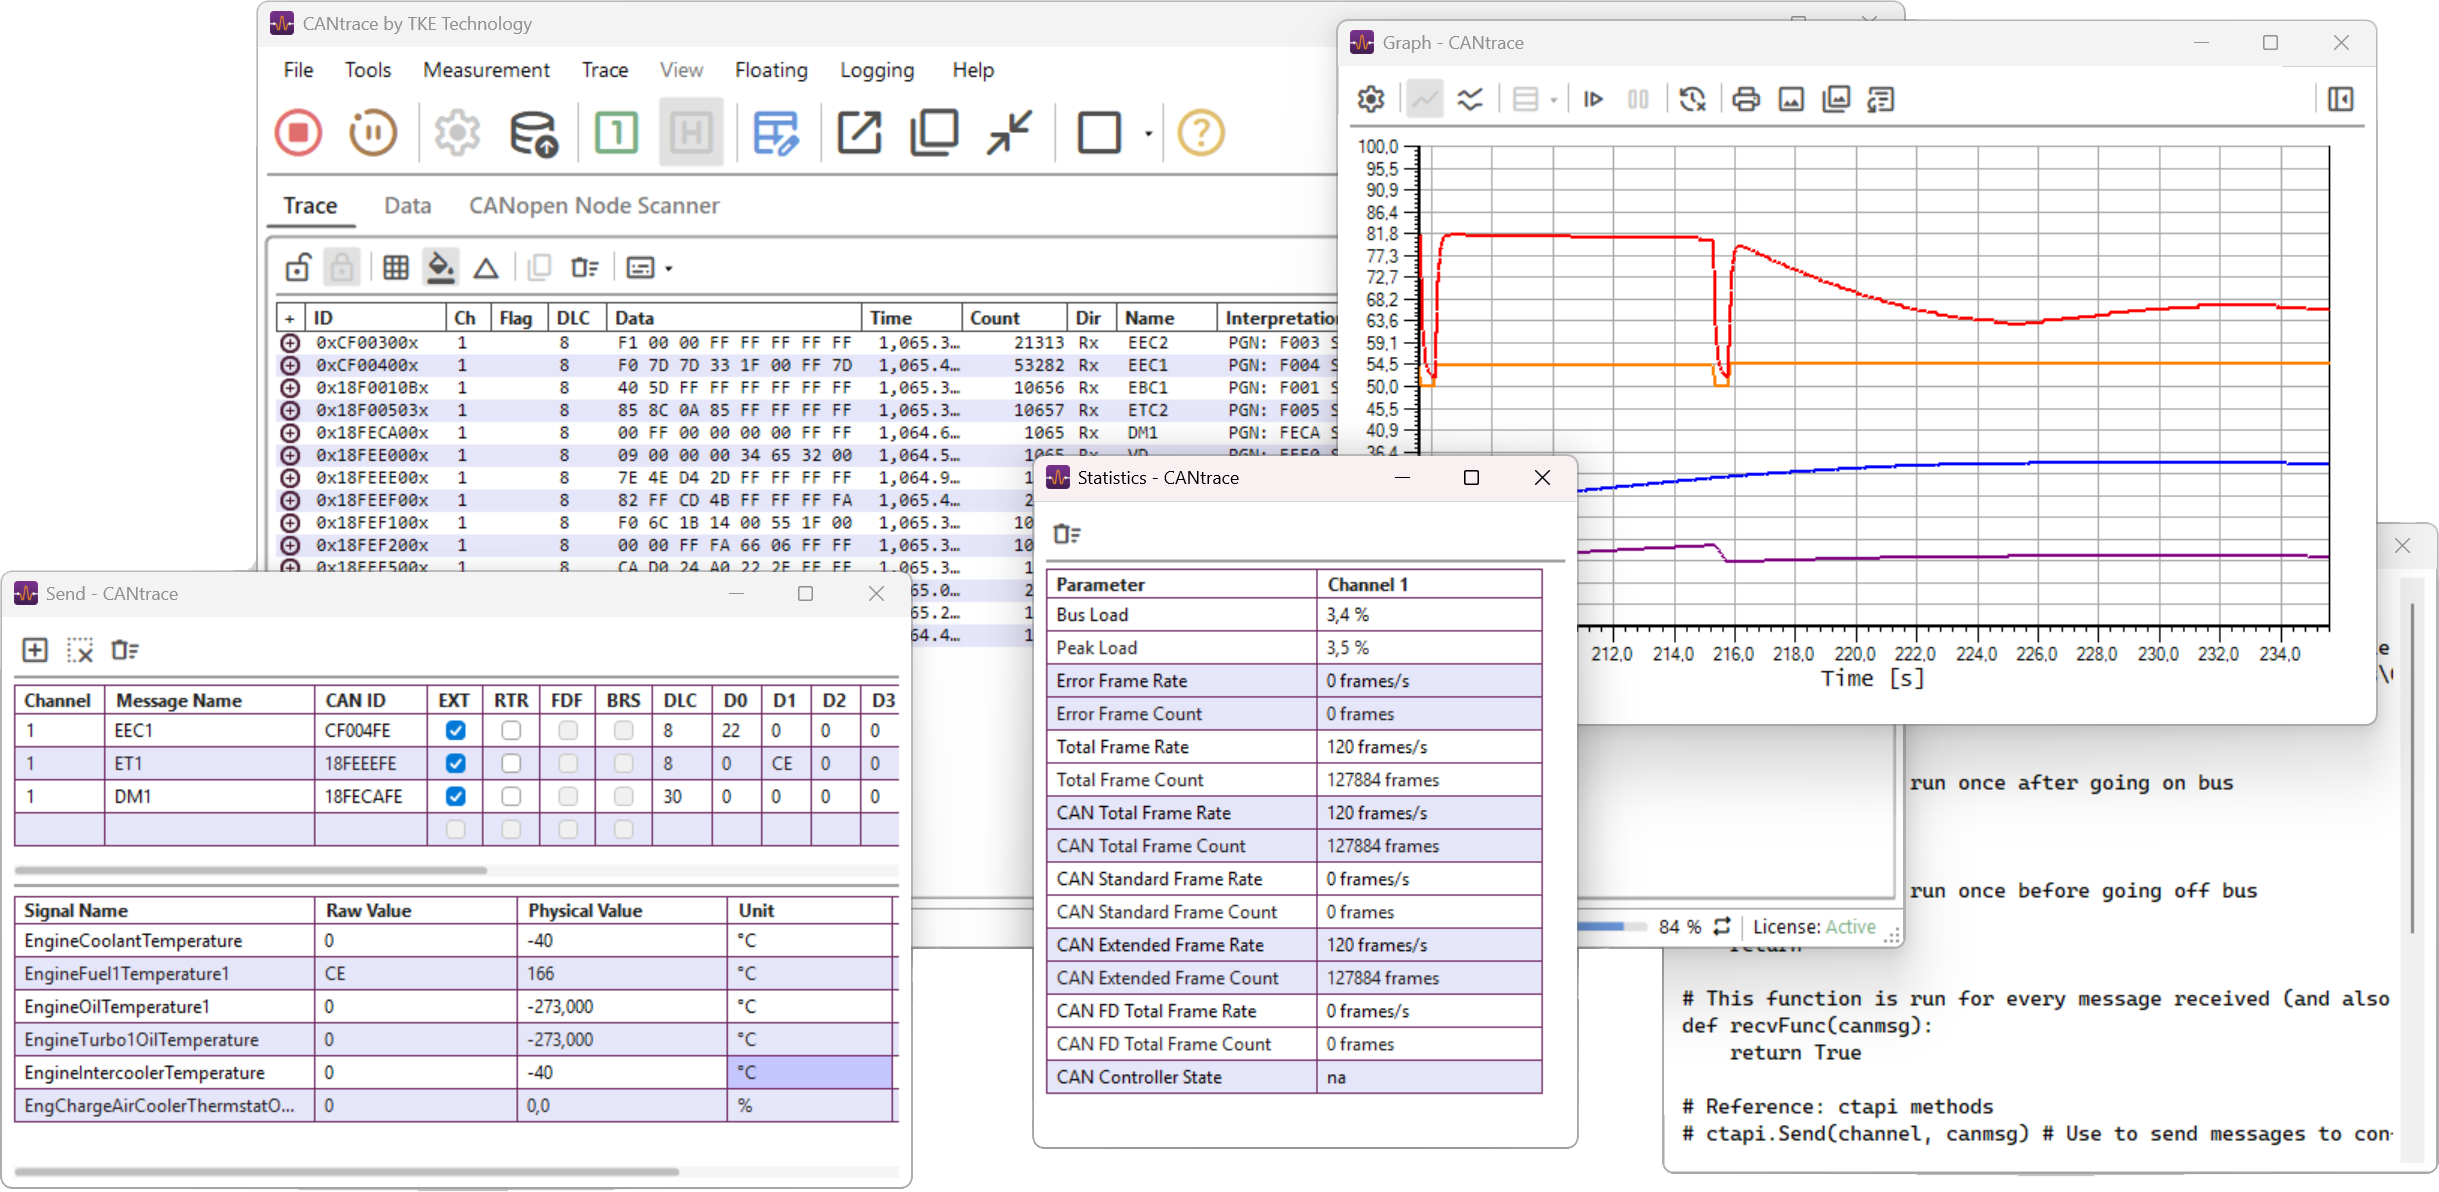
Float windows across screens
Move tabs into separate windows and place them where you need them, including on a second monitor.
Arrange views in a grid
Show up to four views in the main window. Resize the sections and move tabs between them to suit your workflow.
Save your workspace
Save layouts, divider positions and floating window positions with your project, ready for your next session.
Live data values
Signal Values in Real-Time
Monitor selected database signals in a clear, real-time table, without searching through the message trace.
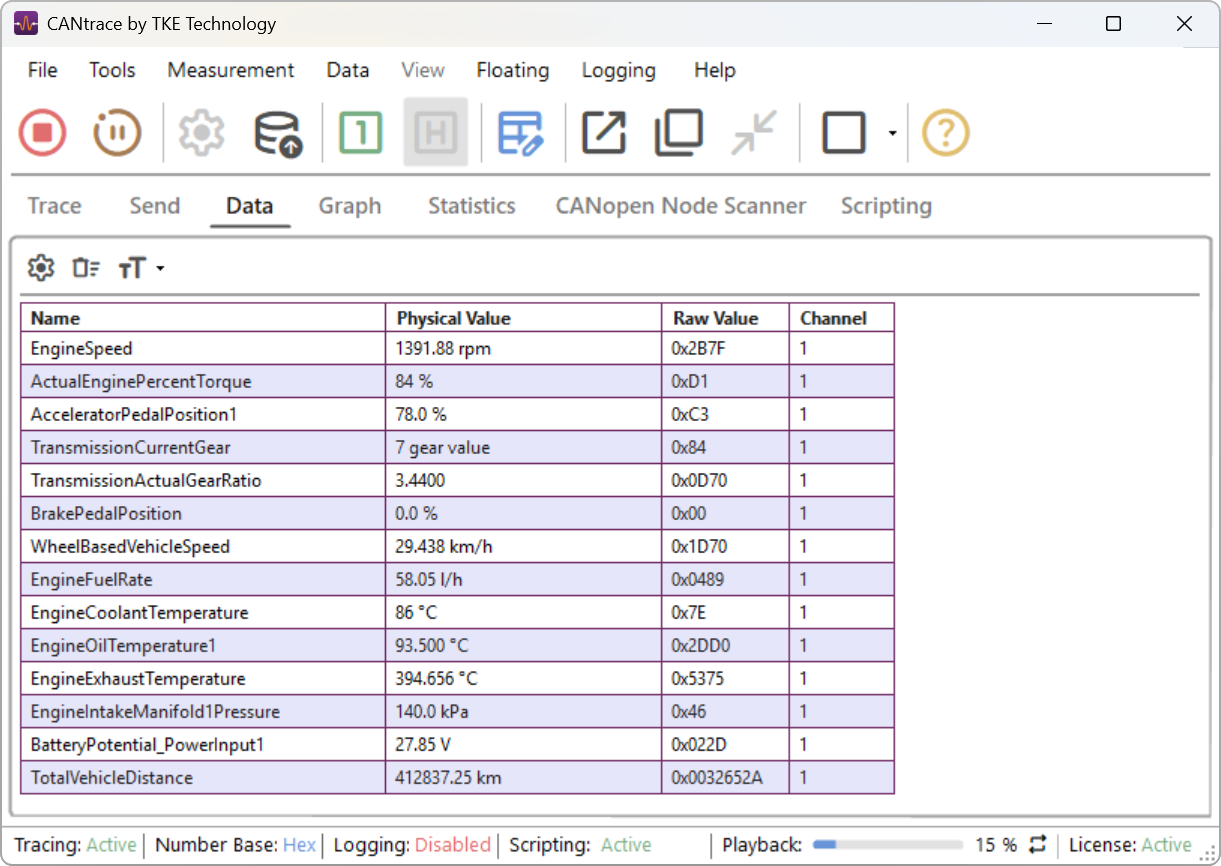
Choose your signals
Select signals from your database or reuse the signals already configured in Graph.
View decoded values
Read physical values and units or database-defined text descriptions.
Compare with raw data
View raw values and CAN channel information alongside decoded values.
Customize your workflow
Python Scipting
Run scripts in real time to process incoming and outgoing CAN messages. Use common Python modules to build custom analysis and automate repetitive tasks.
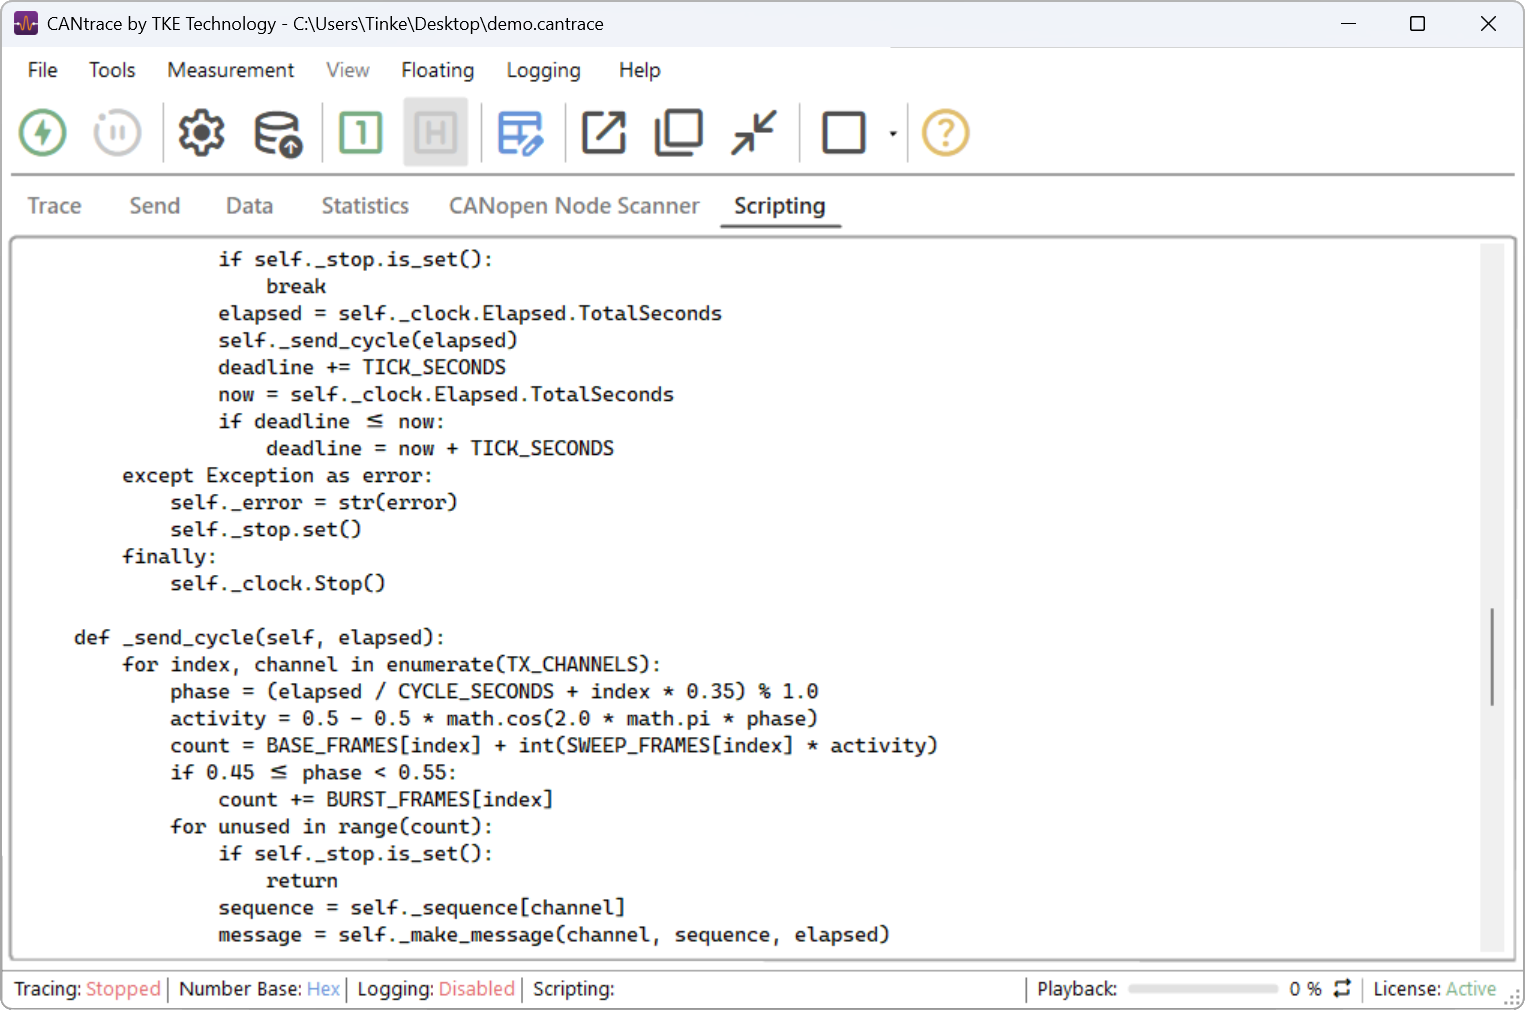
Filter CAN messages
Select incoming and outgoing messages using custom rules.
Modify and create messages
Change message data or generate new messages with your own script logic.
Automate repetitive tasks
Script recurring processing and analysis steps to reduce manual work.

Olli Inkinen
Software Engineer

Rickard Bäckman
Software Engineer